Authors: Holger Müller, GfS mbH Aachen, and Georg Götz, BMW AG, Munich
(published in: Elektronik Informationen 9/96, translated from German)
Because of increasing air pollution, the traction battery for electrically powered vehicles remains the subject of intensive research by battery manufacturers. As a result, vehicle manufacturers working on electric or hybrid drives are confronted with numerous new battery technologies and cell variants of widely differing types and performance parameters. The procurement costs of the various batteries, their performance parameters and the achievable service life are the key selection criteria. They determine the driving performance of the vehicle and thus customer acceptance. In order to limit the costs of test benches and test specimens when evaluating new technologies and to minimise test bench set-up times, BMW in Munich implemented a concept for testing single cells and then extrapolating the determined parameters to the complete battery. The system is also suitable for testing high-capacity double-layer capacitors (supercaps), which are used in motor vehicles to cover peak loads.
The standard software DIA/DAGO is used to control the test sequence, to output setpoints and to visualise the measurement results, as its modular structure and the implemented customising functions allow it to be adapted optimally to the measurement task. The program is the interface to the user, implements the first control level – the setpoint output for charging and discharging – and controls the measurement sequence as well as the acquisition and processing of the measured values. The second control level consists of analogue controller circuits based on operational amplifiers, which are directly connected to the power electronics.
PC and controller circuits are connected by a Data Translation DT 2812 measurement card and a Bedo signal connection unit. The measurement card provides eight analogue/digital inputs, two digital/analogue outputs and 8 digital inputs and outputs each. Accordingly, the signal connection unit consists of one eight-channel digital input card and one eight-channel digital output card, a two-channel D/A output card and four two-channel A/D input cards (Figure 1).
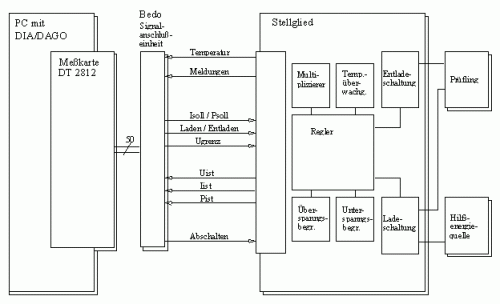
Measurement sequence
The measurement sequence was designed to be self-explanatory in order to make familiarisation easier for a changing group of users. After starting DIA/DAGO on the PC, the operator can freely specify the time profile of the charging or discharging of a battery cell and the desired setpoint quantity (current or power), or select permanently stored power profiles, by calling up various menus adapted to the measurement sequence. A manual mode also allows online setpoint entry via the keyboard during a running measurement. Depending on the required accuracy, different measuring ranges can be selected in the program.
When the corresponding menu items are activated in the user structure diagram, which also serves as a table of contents of the respective program component, an autosequence starts. It opens an input form for specifying the initial energy state of the test specimen, loads the DAGO setup required for the measurement, configures the online display of the measured values and, by setting variables and generating data channels, causes the measurement card to output control commands (charging or discharging, setpoints of current or power). These signals are transmitted by the signal connection unit and adapted to the actuator. Depending on the type and magnitude of the specified setpoint and on the actual value of the current or power, the charging or discharging electronics control the charging or discharging of the test specimen. The charging energy is supplied by an external voltage source. In both cases, 30 power MOSFETs connected in parallel, driven directly by the respective controller, serve as switching elements.
In addition to the primary functional units, there are modules that implement auxiliary functions, such as the power supply for the controller circuits and the control of the fans used to cool the power electronics.
Operating parameters from practice
Since the performance data of the battery manufacturers, obtained under laboratory conditions (constant current discharge, stable cell temperature, elaborate charging technology), do not allow reliable conclusions about the driving performance achievable with the respective battery, the battery cells are tested under conditions close to real operation. Standardised driving cycles, as used for combustion engine vehicles to determine average fuel consumption, were therefore chosen as the starting point for developing the setpoint specifications: the ECE consumption cycle, the FTP-75 city cycle and the highway cycle. The conversion of the consumption cycles, defined as speed profiles, into power-time profiles was carried out using the simulation program FVV (driving performance and consumption comparison) developed by BMW for internal use. The calculation was based on the data of a BMW 316i (E36) contained in the program. The resulting time profiles of the power at the wheel formed the basis for calculating the required motor power. The battery power was determined on the basis of data from a Siemens motor/inverter assembly. The calculations resulted in ASCII files containing battery power profiles which – loaded and saved in DIA channel files – form the basis for cycle-controlled measurements. To measure a single cell, the total power is divided according to the number of cells in a battery. After the user has entered the number of cells, this is done automatically in an autosequence. With a typical cell count between 150 and 200 and the vehicle and drive data mentioned, the power to be handled is limited to about 300 W, while the test stand is designed for a maximum power of 1 kW. During a cycle measurement, the single battery cell is in principle stressed as if it were part of the traction battery of a vehicle completing the corresponding driving cycle. The measurement results are output automatically in standardised charts whose legend shows the parameters specified by the user during measurement preparation (Figure 2).
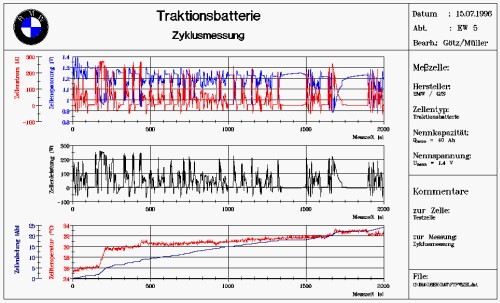
Software functions
During measurement preparation, the test stand is also used to charge the cells to be tested, so that with the usual time-dependent cell charging there is a risk of overcharging cells with a high initial or residual charge. To rule this out even when the system is operated unattended, a DIA/DAGO function for overcharge cut-off was added. It is designed so that both the drop in cell voltage after the charge maximum has been reached and the rise in cell temperature at the onset of overcharging can be used as cut-off criteria for alkaline and acid battery systems. Depending on the cell type and the course of the charging process, the parameters of an end-of-charge criterion are to be determined and entered into the flexibly defined condition definition.
To protect the test specimens during measurements, their terminal voltage must be limited – downwards for battery cells and upwards for supercaps. This function is performed by special limiter circuits, which are activated alternately by the software depending on the previously entered description of the test specimen. The user specifies the respective voltage limit in special DIA menus.
To ensure smooth commissioning of the system, especially after a longer period of standstill, an automated self-diagnosis is provided. The self-diagnosis is started by calling an autosequence when DIA/DAGO starts up; it can also be called from the DIA user structure diagram. The autosequence opens input forms used to adapt the test sequence to the connected test specimen, loads the diagnostic setup and starts the test sequence. The test sequence begins by checking the supply voltage required for all functional elements as well as the terminal voltage of the test specimen and the auxiliary power source, since these are used to test further components. In the further course of the test, the operation of the charging and discharging controls and of the voltage limiter circuits is tested using characteristic setpoint profiles. Depending on the test result, messages are output which, in the event of an error, contain not only a description of the error but also a list of typical causes. This allows the error to be localised to a large extent.
Summary
Comparisons between the performance potential of a battery predicted by single cell measurement and the available battery power determined in vehicle use showed a deviation of only 5%. Assuming that other users are also interested in a reliable and cost-effective evaluation of new battery systems, the production of a small series of single cell test stands was considered; thanks to the flexibility of the standard software DIA/DAGO, the system can easily be adapted to different measurement tasks with the same hardware configuration.